
NOC plugin suite · network operations centre
Your whole estate, one operations wall.
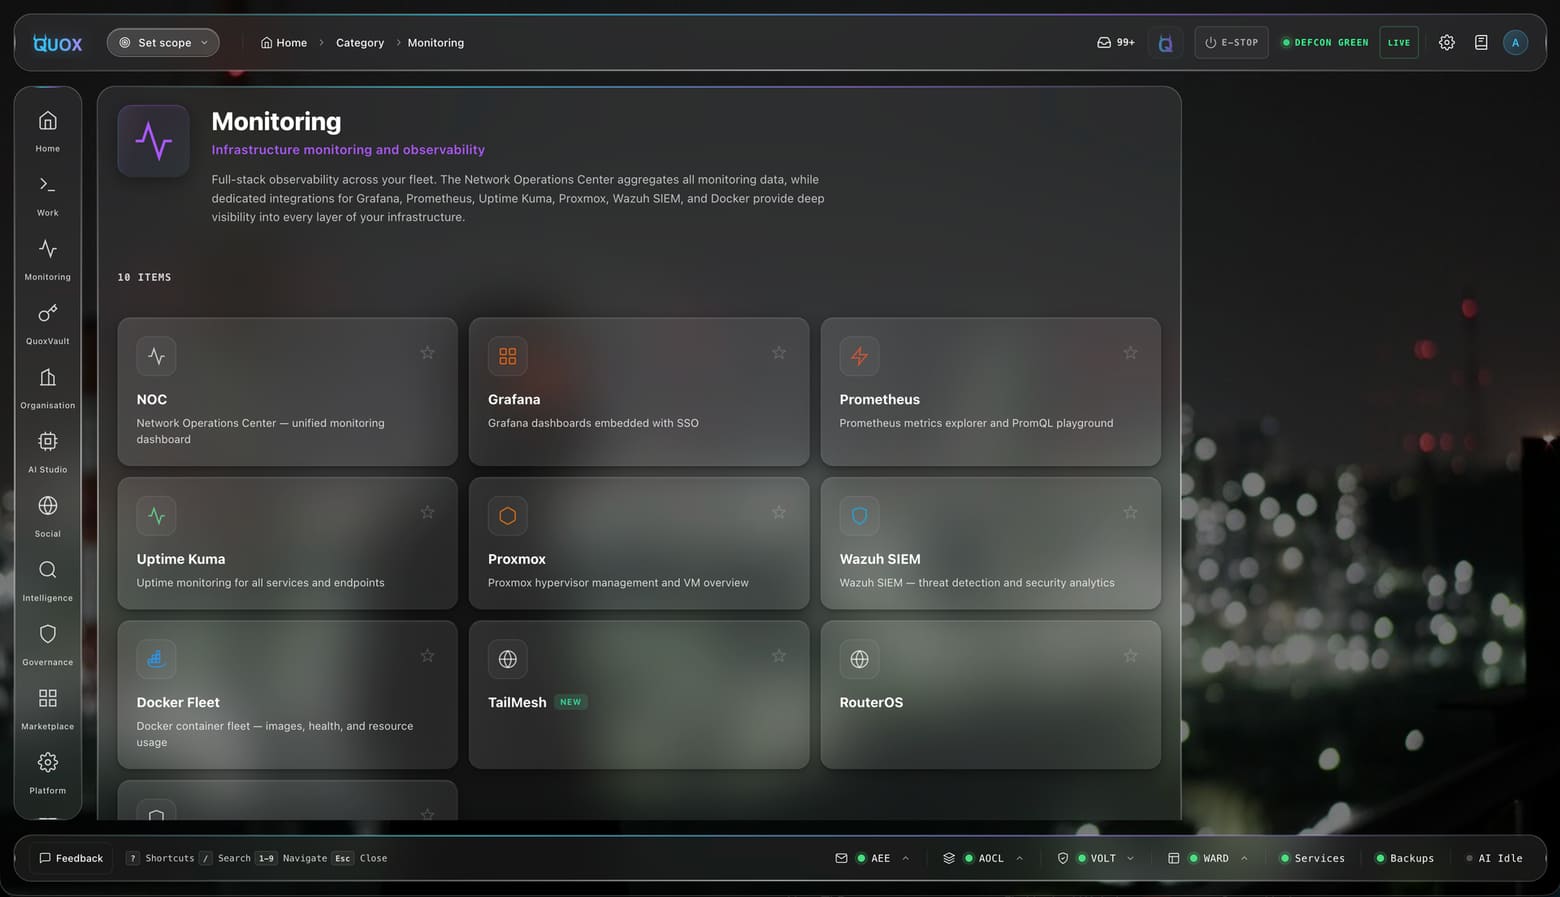
NOC is the aggregator view inside QuoxCORE. It pulls the widgets, alerts and quick actions from your installed monitoring plugins into a single command centre.
Illustrative recreation. On your install, NOC shows your own hosts through QuoxBastion and the widgets of the plugins you have licensed.
In plain words
What it is, where it lives, when to reach for it
- What is it
- A free plugin for the QuoxCORE dashboard: one operations wall that aggregates your other monitoring plugins.
- Where do I use it
- On the NOC view in your dashboard, with tabs contributed by Proxmox, Prometheus, Grafana and Uptime Kuma.
- When would I use it
- When you want your hosts, metrics, uptime and alerts on one screen instead of four browser tabs.
- How do I use it
- Add it free from the store; without QuoxBastion configured it shows labelled demo hosts, not your fleet.
QuoxCORE is the free, self-hosted platform underneath this. What is QuoxCORE
Honest scope
An aggregator, not another dashboard.
A single three-column command centre: suite rail on the left, live fleet and operations in the middle, an agent at the desk on the right.
Prometheus keeps your metrics. Grafana keeps your dashboards. Uptime Kuma keeps your monitors. NOC does not replace any of them. It is the wall they all report to: each monitoring plugin you install registers its compact widget and its quick actions with NOC, and the operations view assembles itself from what you own.
The fleet grid is fed by QuoxBastion. Hosts are pinged through the bastion, grouped by category, refreshed every 30 seconds, and each one opens into a detail pane with one-click health, disk, service and Docker checks. Locked cards show you what a plugin would add before you buy it, and the whole wall pops out into its own window for a multi-monitor desk.
Compact widgets from your installed plugins: Proxmox nodes, Prometheus metrics, Uptime Kuma monitors, Grafana embeds, with one click through to each full page.
widgets · licence-gatedLive host grid with ping status and latency, fleet health summary, thirteen one-click checks, plugin quick actions, and a 24-hour tool health panel.
bastion-fed · confirm-gatedAn ops agent sits in the third column with the fleet state as context. Ask what broke, have it run a check, and watch the result land in the operations feed.
agent-selectable · in contextAlso on the wall: Grafana alert badge polling every 30s · popout window for multi-monitor NOC desks · CLI cockpit hand-off for keyboard-driven fleet work
One-click operations
Checks you would type anyway, one press away.
The operations grid holds thirteen one-click checks, from disk usage and CPU across the fleet to SSL expiry, DNS resolution and firewall audits. Installed plugins contribute their own quick actions to the same grid.
- Every run goes through a confirmation step before anything executes
- Results land in an operations feed with a 24-hour tool health panel
- Per-host actions from the detail pane: health, disk, services, Docker
- Runs are witnessed on the platform’s WARD audit chain like every other agent action
CHECK                    SCOPE
health check             all hosts
disk usage               flag > 80%
ssl certificates         expiry sweep
error logs               last warnings
security scan            posture check
docker                   all containers

RUN
❯ disk usage → confirm → execute
✓ 8 hosts checked · 1 flagged (nw-hv-02 84%)

What it unifies
Five shipping instruments.
Each one is a full plugin with its own page, its own price and its own standalone view. NOC is where they report for duty together.
- Proxmox VENodes, VMs and containers: your virtualisation layer on the wall$29 one-off
- Prometheus IntelligenceMetrics, PromQL and alerting: the numbers behind every graph$19 one-off
- GrafanaDashboard search and alert states, one search awayFree one-off
- Uptime KumaMonitors, uptime history and status pages$9 one-off
- MikroTik RouterOSRouter health, interfaces and configuration, governed$35 one-off
RouterOS registers on the NOC wall too, but it is sold separately and is not part of the NOC Suite Bundle below. Adjacent, on the security side: the Wazuh plugin ($25) feeds the SOC rather than the NOC. It registers quick actions with the wall too, but it belongs to the security desk.
NOC Suite Bundle, $49.
Uptime Kuma, Prometheus, Grafana and Proxmox, bundled: four monitoring plugins for $49, 14% off the $57 you’d pay buying each paid one individually (Grafana is free on its own). RouterOS is also available, separately, and is not part of this bundle.
requires QuoxCORE 1.0+ · each plugin connects to your own instances · licence: commercial · pay once per plugin
On the roadmap
The wall keeps growing.
Planned additions to the NOC suite. These are in the build queue, honestly labelled: none of them is purchasable today, and no dates are promised.
- 01Loki log aggregatorsearch logs across the fleet with LogQL, live tail includedplanned
- 02Certificate monitorexpiry countdowns, chain validation, change detectionplanned
- 03Proxmox Backup Serverdatastore capacity, backup freshness, verify jobsplanned
- 04NetFlow traffic analysistop talkers, protocol breakdown, per-interface bandwidthplanned
- 05DNS managerquery stats, block rates, record managementplanned
Each will register with the NOC wall the same way the shipping plugins do.
How you get it
Free in the store, and it stays free
NOC Operations costs nothing. The monitoring plugins it draws from are the priced part.
On its own
The network operations console for your own QuoxCORE instance: one surface for uptime, alerts and incident state across everything you run. No licence key.
The full NOC suite
The console is free. The NOC Suite Bundle is the monitoring stack that fills it: uptime, metrics, dashboards and host telemetry, priced together rather than one plugin at a time.